Restoring Safety of the Ventilation Systems in the Fellbach Road Tunnel
In Fellbach, through traffic has been conducted through a road tunnel since 1997 to relieve the downtown area. There are 4 rows of jet fans each possessing 6 aggregates distributed throughout the tunnel in order to provide ventilation. These fans are switched on and off depending on the wind direction and the CO impact so that the fumes caused by traffic are removed via the tunnel entrances.
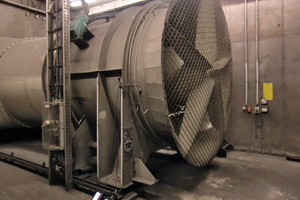
In addition, in the eastern part of the structure there are 2 axial fans, which can remove dangerous gases from the tunnel via 2 vertical stacks (Fig. 1) in the event of fire or an increased CO2 load. In this way it is ensured that it is still possible to evacuate the tunnel even should fire break out.
Within the scope of the safety technical test of the entire system in summer 2011, the fixed installed vibration monitoring system established that one of the two axial fans registered excessive vibrations in its upper speed range. These vibrations were in excess of the permis-sible values in keeping with DIN ISO 10816-3. The Werner Krauter GmbH was subsequently commissioned to clean the machines, in order to eliminate possible imbalances caused by contaminants. However as the vibrations were still excessively high even after cleaning the impellers, the company was also asked to establish the malfunctions and then eliminate these.
As a specialist for repairing electric motors Krauter has been using the Universal Vibration Ana-
lysis and Balancing Unit Vibxpert from Messrs. Prüftechnik since 2009. Thanks to this unit standard approval measurements for the vibrations as well as diagnoses for the causes of vibrations can be ascertained. If imbalances are determined as the source of the vibrations, the necessary compensation measurements and their positions on the fan impellers can be established with the unit.
Approval Measurements and Diagnoses
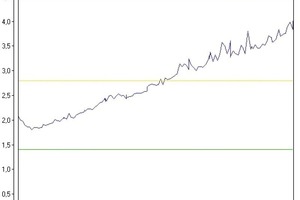
Extensive measurements of the vibrations with Vibxpert on the spot after cleaning the fans revealed that the values for axial fan 2 were above the alarm limits and had to be reduced to ensure proper operation. In this condition the stationary monitoring system (veff 10 to 1,000 Hz) failed to show any alarm violations for fan 2 (Figs. 2 + 3). At axial fan 1 the overall vibration values given maximal speed were still just below the limit values for “warning”. However, the alarm reports originally described had already been recorded on the stationary system for this fan.
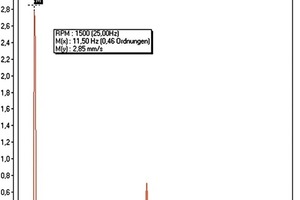
Corresponding vibration analyses on both fans indicated that in each case the rotational frequent components were dominant (Fig. 4).This meant that the prerequisites for reducing the vibrations by balancing the impellers existed. By means of these data the balance quality of the aggregates in their current and final condition could also be documented.
Residual Imbalances
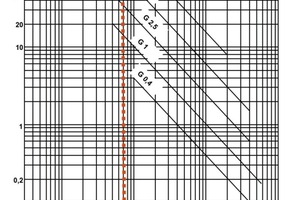
Permissible residual imbalances related to the rotor mass are provided in DIN ISO 1940 regardless of the maximal operating speed. The corresponding quality class applicable results from the type of machine and its range of use. The fans for exhaust air systems are general-ly placed in the G 6.3 quality class. With the chosen values the outcome is a permissible residual imbalance mass of uzul = 80 g x 500 kg / 500 mm = 80 g on the 500 mm compensation radius (Fig. 5).
Balancing by Adding a Compensation Mass
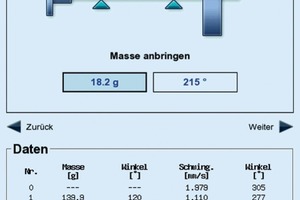
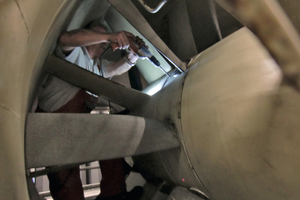
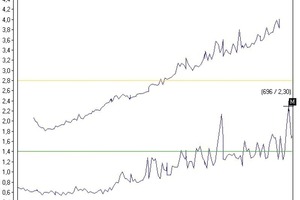
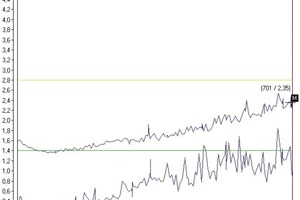
After the initial imbalance run is carried out (establishing the actual condition) the balancing procedure with Vibxpert was started with a test mass on the 500 mm radius and the required compensation weight of 137.5 g for the angle position of 65° determined and applied (Figs. 6 + 7). As a result, the rotational frequent vibration components improved for the selected balancing speed of 1.979 to 0.147 mm/s and the residual imbalance from approx. 140 to 18 g/kg. The fan then complied with the criteria for quality class 2.5 after being improved in this way. Fig. 8 displays the overall vibration values in the complete speed range prior to and after balancing. Fan 1 was also correspondingly analysed and balanced (Fig. 9). Following these measures the machines were handed over to the operators in a reliable state.
Effective Monitoring System
The permanently assembled monitoring systems, however, still supplied erroneous information. The cited values for fan 2 were too small and alarm reports were repeatedly provided for fan 1. Tests also had to be undertaken here as well and faults in the monitoring system eliminated.
The reason for the excessively small display values was rapidly found. The cause was a systematic error regarding how the system was originally set up. The existing monitoring systems were designed for fans with speeds in excess of 600 rpm with a fixed band-pass filter, which suppressed all vibration components less than 10 Hz (corresponding to 600 vibrations/min). As a consequence vibrations can only be measured correctly (particularly the rotational frequent components) as from 600 revolutions and above. An assessment of the condition at lower speeds is thus precluded. As a result, the fans have to be accelerated to their maximal speed – possibly also involving impermissibly large imbalances – before an assessment of the vibration performance can take place.
Systems, which supply correct overall values as from 2 Hz (as is the case with Vibxpert during the assessment) are more suitable for such operat-ing conditions. The systems installed in the Fellbach Tunnel were neither suitable nor convertible for this operating mode. In addition, the alarm reports for fan 1 could be attributed to a technical defect in the measuring chain, as a result of which it would have been necessary to replace the unit to restore the system’s properties.
In conjunction with the operator and the responsible planning office a modern and effective system from Prüftechnik Condition Monitoring GmbH with a 2 to 1,000 Hz frequency range was subsequently installed. Now all the prerequisites are available for proper operation of the system and for straightforward regular testing of the vibrations by means of the new Vibrex monitoring systems and visualisation in the control centre (Fig. 10).


