Integral Consideration of Cost, Schedule, and Risks
Large-scale projects involve a high investment volume, a high degree of uncertainty and extended delivery schedules. A digital project risk twin is an advantage in this regard, allowing uncertainties and correlations between cost, schedules and risks to be displayed and analysed transparently.
1 Introduction
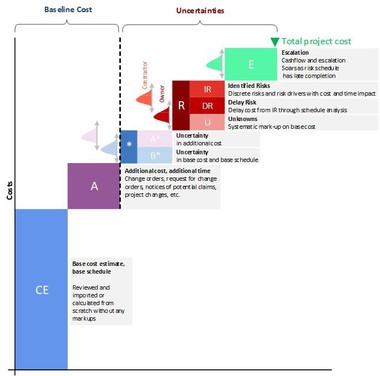
In the first part, “Risk Management and Contract Models in Tunnelling: Risk Management Basics”, the relevance of transparent cost and risk management in large infrastructure projects was presented – in particular the main cost components and their composition. To successfully measure and control cost and schedules, a comprehensible assessment of risks is necessary. In comparison to deterministic methods, probabilistic methods provide valuable information on uncertainties [1]. The fundamentals outlined in part 1 are illustrated using a digital project risk twin (PRT).
2 Integral Modelling of Cost, Schedule and Risks
2.1 Fundamentals of Integral Modelling
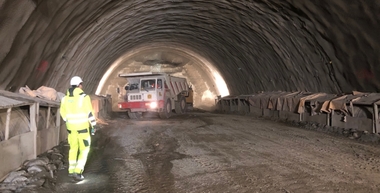
The integration of scheduling into risk management is important because – as many examples of major projects show – it is often the cause of massive cost overruns. Particularly in infrastructure projects like tunnel construction, events such as a jammed tunnel boring machine (TBM) can lead to massive losses in terms of both time and money.
The cost and time approaches are fundamentally different, but correlate with each other (there is a dependency between the two elements). If money is not spent, it remains in the budget and can be used at a later date as required. If, on the other hand, time is not used efficiently, it expires and is lost forever. In this sense, time cannot be controlled. Due to the dependency on money and time, this characteristic of time is also transferred to the financial aspects of major projects. Efficient construction time management cannot be achieved by simply measuring performance or contractually stipulating penalties; the forecasting nature of construction scheduling must be taken into account in the analysis. The value of a schedule therefore lies not only in the control of the construction time, rather it is of overriding importance.
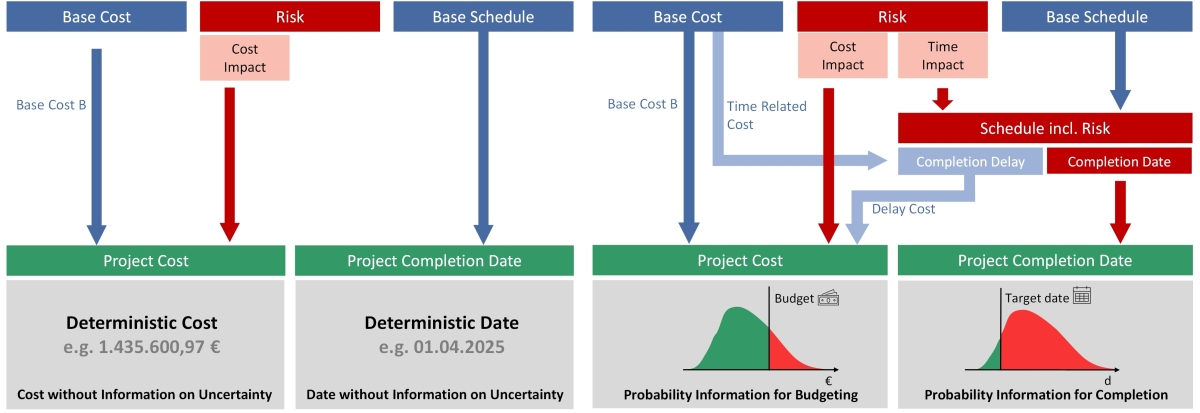 1 | Left: standard project management approach; right: Integrated cost, risk and schedule model
Credit/Quelle: Sander, Becker, Friedinger, Spiegl
The conventional approach in project management (see Fig. 1, left) of viewing cost, risks and scheduling separately does not take into account the interdependence of time and cost. In addition, forecast values are often used as the basis for decisions without any information on uncertainties whose actual occurrence is close to zero. With this silo thinking, the components of costs and time cannot be modelled realistically.
The integral model (see Fig. 1, right) links risks with a potential construction time impact to the schedule processes in order to determine the completion date, construction time delays and potentially critical paths, taking into account the identified risk scenarios. The result of the construction time simulation (deviation from the target date) is integrated into the work breakdown structure (WBS) and linked to time-related costs. This means that the costs from construction delays are taken into account in the overall result [2, p. 24–25].
2.2 Digital Project Risk Twin for Cost, Schedule and Risks
A Digital Twin (DT) is a representation of a tangible or intangible object or process from the real to the digital world [3, p. 3]. DT has become a household word in large infrastructure projects as technological advances in modelling and simulation make it applicable.
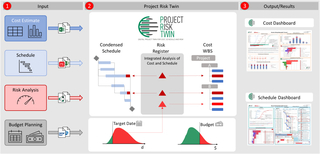 2 | Digital project risk twin for infrastructure projects
Credit/Quelle: Sander, Becker, Friedinger, Spiegl
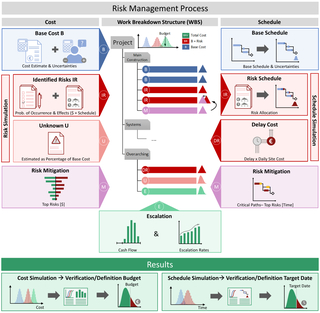 3 | Project risk twin, process
Credit/Quelle: Sander, Becker, Friedinger, Spiegl
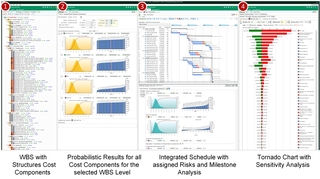 4 | Sample main interface RIAAT software
Credit/Quelle: Sander, Becker, Friedinger, Spiegl
Figure 2 shows the elements of a DT for cost and schedule in infrastructure projects with the corresponding steps: the input/system integration of cost, schedule, risk, and budget data are gathered at the beginning (Fig. 2 (1)). In the PRT (Fig. 2 (2)), the data is linked by software. Simulation is used to perform an integrated cost and schedule risk analysis including uncertainties. The analysis results are processed and displayed in the form of individually tailored dashboards (Fig. 2 (3)).
The PRT is made up of several components. Figure 3 shows chronologically from top to bottom the process steps to create such a model. Starting with basic cost and basic schedule planning, through risk analysis and risk mitigation, to the selection of an approach for escalation (future price increase).
In the lower part of Figure 3, the results for cost and schedule are shown. Furthermore, a distinction is made between the sub-process for the cost in the left part of the graphic and the sub-process for the schedule in the right part of the graphic. In the middle, the work breakdown structure is shown, which structures the recorded cost items hierarchically so that they can be analysed individually. Figure 4 (1) shows an example of how the cost items are integrated into the WBS.
At the beginning of the process (see Fig. 3), the Base Cost (B) is determined and uncertainties for quantities and prices are evaluated [4, p. 2]. Equivalently, a Base Schedule is created. It is recommended to have the results validated by external experts.
This is followed by the risk analysis. In the first step, the specific risk scenarios are identified, described and quantified in terms of their probability of occurrence and impact on cost and construction time. In order to take uncertainties into account, the evaluation is carried out by means of three-point estimate (worst, expected and best case). Both positive (opportunities) and negative (threats) effects are considered from the perspective of the two contracting parties, client and contractor (see Fig. 4 (2)).
Risks which could delay construction completion trigger additional time related cost in most cases. To calculate the delay cost the potential delay due to risk impact is linked with time-related cost from base cost [5, p. 24] (see Fig. 4, (3)). All information is obtained in moderated workshops attended by the client-side project team. A conditioning of the participants is necessary in advance of the workshops. Important goals are to raise awareness with regard to risk management and to reduce optimism bias (self-overestimating optimism).
In the second step of the risk analysis, the Unknown (U), consisting of non-identified and non-identifiable risks, is considered. Structured questionnaires are used to evaluate the project based on numerous factors such as maturity, complexity, geological conditions and market situation. The result is a project-specific percentage surcharge on base cost, which also takes into account the quality of the individual risk analysis performed. A higher degree of complexity and particularly unfavourable geological conditions result in a higher surcharge to be applied [6, p. 20].
For risk management, the impact of the individual risks on the overall project is analysed (e.g., sensitivity analyses, what-ifs, critical paths, etc.) (see Fig. 4, (4)). Appropriate risk mitigation measures can be derived from this to mitigate high impact cost and schedule risks. The risk mitigation measures can be quantified in advance by simulations and evaluated in terms of their cost-effectiveness. This provides a solid base for decision-making [5, p. 25]. The cash outflow over the entire project duration is used to calculate Escalation (E – future price increase). For long-running projects, high inflation cost must be expected due to the compound interest effect, which must be taken into account for both base cost and risks.
3 Outlook
The use of a digital project risk twin enables the transparent visualisation of uncertainties and correlations between cost and schedule. This leads to an improvement in the achievement of project goals. In order to minimise risks, suitable measures and/or corrective measures must be selected. Part 3 deals with risk management. It shows what measures are available to manage risks and what effects they have.
This publication is supported by dtec.bw – Centre for Digitalisation and Technology Research of the University of the Bundeswehr (DigiPeC – Digital Perfomance Contracting Competence Center).

